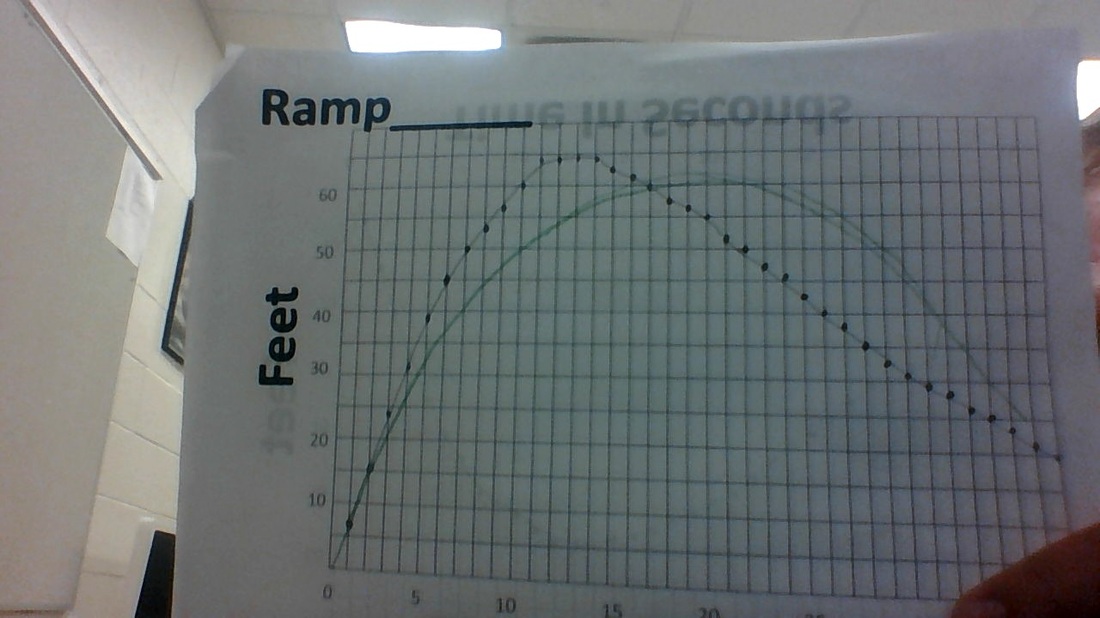
This graph shown above is the distance(in feet) that a skateboard dropped from a 21 inch ramp travels over a 35 second period. The driveway that skateboard was on was slanted, hence the skateboard declining in distance. The dotted line is that of the actual skateboard run and the green is that of my prediction of what the distance traveled would be. I wasn't very close with my guess on this one.
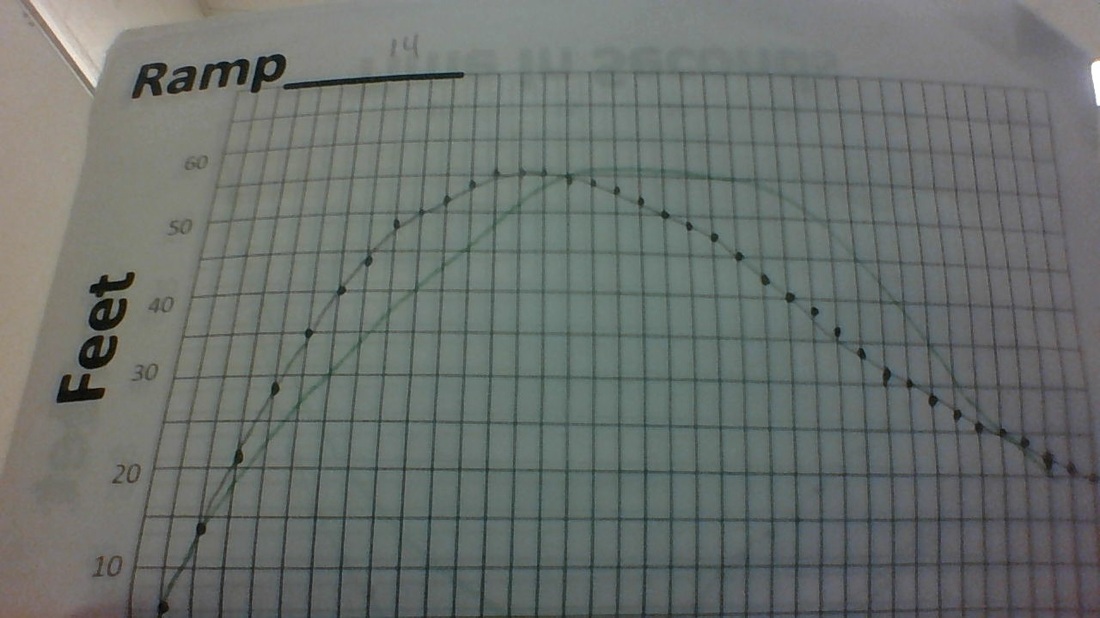
The graph above shows the distance traveled of the same skateboard in example 1. The difference is that the skateboard is dropped down a 14 inch ramp. The rate of increase of distance is relatively the same as that is Ex. 1 but doesn't travel as far. Then decreases in distance after a certain point and goes back down the drive way.The dotted line is that of the actual skateboard run and the green is that of my prediction of what the distance traveled would be. I was still pretty far off on this one.
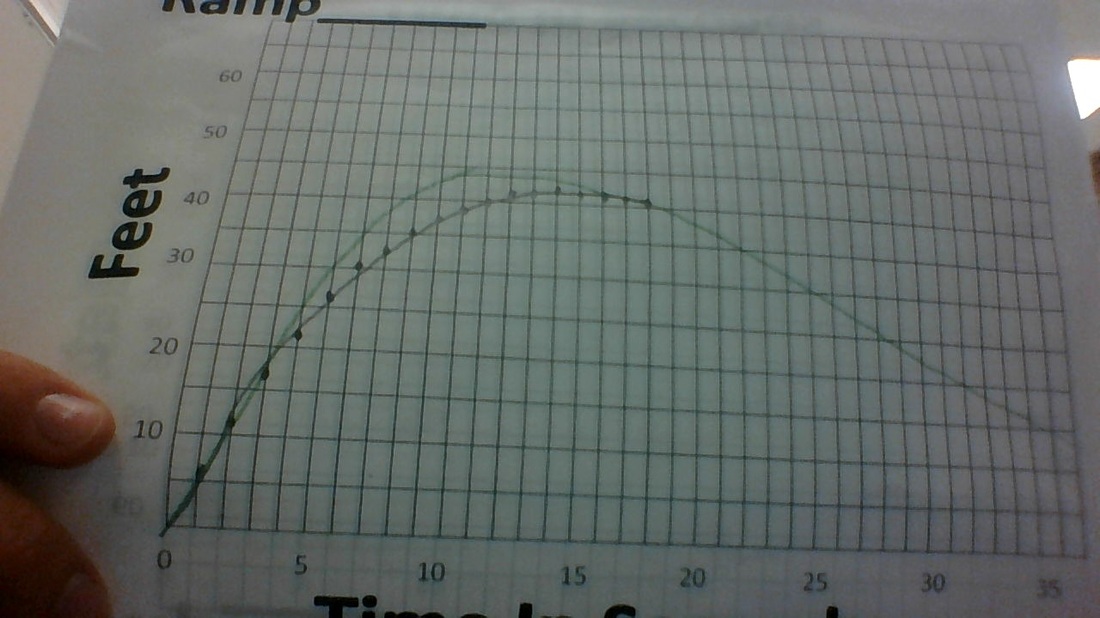
This graph is that of the same skateboard in Ex.1 and Ex.2 but is dropped down a 7 inch ramp. This graph doesn't increase as fast as the first two but still manages to reach a descent distance. The dotted line is that of the actual skateboard run and the green is that of my prediction of what the distance traveled would be. I was pretty close on this one.
 RSS Feed